
There is one thing that separates elite athletes from average athletes. Elite athletes use the power of guided imagery or visualization. Studies show that visualization increases “athletic performance” by improving motivation, coordination and concentration. What if enterprises can do the same with “IT performance”? Let their DevOps product teams continuously visualize outcome as they perform their everyday tasks. As with athletes in sports, DevOps can then become a team sport with DevOps product team members visualizing and performing to what better looks like with improved motivation, coordination and concentration.
This is illustrated no better than by HP Laser Jet case study (brilliantly articulated in the book, A Practical Approach to Large-Scale Agile Development). HP’s management was able to provide their 400 product team members across 3 continents, simple goals that fit on a single piece of paper every month. Everyone could see every day and reflect on, whether what they do helps make that picture complete (Watch Jez Humble, DevOps guru, talk about this case study). Over 3 years, they were able to reduce development cost by 40% and multiply time on innovations by 8X.
That is Continuous Governance (CG) at work. (I introduced this idea earlier in my post on The DevOps Missing Link Continuous Governance). CG with Continuous Integration (CI) and Continuous Delivery (CD) completes the foundations needed to DevOps at scale. One way to implement CG is to perform the Observe Orient Decide Act (OODA) loop at every level of the organization. The Orient step in the OODA loop is actually about the ability to visualize and reflect on team performance continuously.
There are three (3) ingredients that are important for such an orientation in an enterprise context. First, identification of key transactional metrics that represents IT performance. Second, creation of a consistent method to define and visualize “what better looks like” for those key transactional metrics. Lastly, orient the data across all the variabilities in processes and tool-chains, used by different product teams.
On the first ingredient, Nicole Forsgen and Jez Humble, DevOps gurus, have codified four (4) transactional measures as strong indicators to reflect on IT performance. They are, “Lead time for new changes”, “Release frequency”, “Time to restore service” and “Change failure rate”. In the next two sections, I will present my views on the other 2 ingredients, namely, how to visualize “what better looks like” at team level and variability challenges of doing that at enterprise level.
Orient IT performance at team level
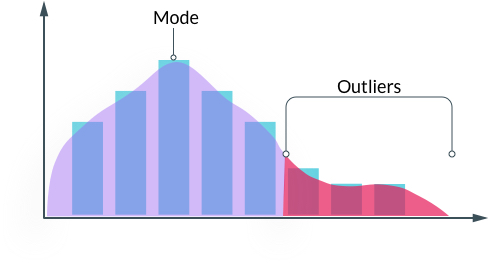
There is a way to see, what better looks like, in a consistent way across all the transactional measures and clearly visualize improvements. David J Andersen, Kanban guru, over the years has exhorted the use of simple representations to visualize everyday transaction using Kappa-distribution. K-distribution is characterized by single global maximum and a tail. K-distribution can be used to highlight “mode” in transactional measure (most frequently occurring performance) as single global maximum and all outliers that we need to worry about as a “tail” of the graph.
For “Lead Time to Change”, the transaction unit could be stories. The X-axis could be in lead time in days and the Y-axis measures number of stories. The stories with same lead time days are stacked upon each other and all stories with lead times 3 times the mode can be treated as outliers.
For “Release Frequency”, the transaction unit could be releases per week. The X-axis would measure the frequency scale for releases in reverse order (such as 8 releases/week, 7 releases/week to 0 release/week) and the Y-axis is the number of weeks with that frequency. This will make weeks with low frequency of releases show up as outliers.
For “Change Failure Rate”, an example transaction unit could be number days a defect remained latent, the X–axis could be in days and the Y-axis in number of defects. So a late detection of defects, such as ones found in production will show up as outliers.
For “Time to Restore Service”, an example transaction unit could be number of hours to apply a patch after the code is committed. The X-axis could be in hours and the Y-axis in number of patches. So that a delay in deploying a patch shows up as outliers.
Orient IT performance at enterprise level
Interestingly, at higher levels of organization, transactional metrics can remain the same, but there will just be more transactions. The meaning of the X and Y axis also remains the same. This will clearly show which teams need to work on improving their mode and which teams should work on reducing their outliers. In every graph, a longer tail means that team has less and less predictability and more and more impact from some kind of avoidable waste.
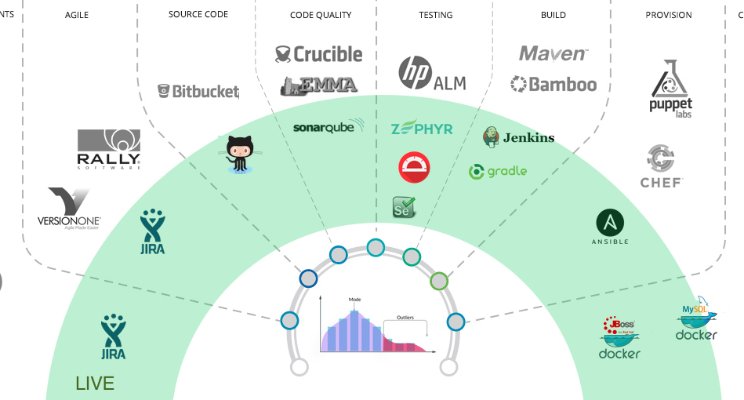
The real challenge however is the sheer variability of processes and tools at an enterprise level and implementation to address variability in capturing these transactions for different product teams without statistically affecting the purpose attached to the transaction. For example, for a product team that follows Continuous Delivery (CD) practices, “lead time to change” transaction can be defined as “elapsed time between Story creation event from an Agile tool (such as JIRA or VersionOne) and deployment event from a tool in Continuous Delivery (CD) Pipeline (such as Ansible or Jenkins)”. But for another product team, the elapsed time could be when a “change request” is raised and closed in their ticketing tool (such as ServiceNow).
There will be many more variabilities in capturing “lead time to change”, such as, how do we normalize story points measures and how do we differentiate “class of service” for a “software patch” transactions from “new development” transactions, but they can be handled through adjustments to measurement. In a similar way, there will be variabilities in each of the transactional measures.
But they are not insurmountable, especially if you have a governance tool that can integrate to APIs of various Agile and DevOps tools (such as GoLean.io, Beware! shameless plug). One can then map each Product team’s tool events to a meta-model that normalizes the transaction measures and statistically preserve its meaning across all teams and at every level of aggregation in an organization.